
KPMG Virtual Internship - Bike Shop Marketing ROI

Using CRM Data to Identify Ideal Customer Profiles and Predict New Sales
Abstract:
Through a dataset provided by KPMG, an Australian bicycle shop owner was looking to maximize their marketing ROI by analyzing data on their customers and transactions for the past 3 years. This was accomplished by developing customer profiles based on data, along with predicting new sales that referenced data on previous transactions and customer demographics. Results provided a data-driven ideal customer profile, along with a baseline predictive model for customers that have been in the CRM for longer than 3 years.
Introduction:
As online sales continue to grow for most companies, so does the importance of using online marketing to help drive in-store traffic/sales as well. And while most teams are doing a great job of acquiring and storing their customers’ information into a customer relationship management (CRM) database via rewards programs and email lists, they are still having a tough time using that data to help drive new sales from there.
In this study, an Australian bike shop owner overcame this dilemma (to maximize their marketing ROI) by using their CRM data on transactions and customers for the past 3 years. With goals to identify: yearly and monthly trends in sales, profitable customer segments and bike lines, top-selling bike lines and top-purchasing customers, and customer traits associated with higher profits / more frequent purchases. By analyzing the data and looking for trends, this allowed for the creation of a data-driven customer profile, along with a potential model to help predict new sales for individual customers in real-time.
Methods:
The study’s dataset came from a KPMG virtual internship for a bicycle shop based in Australia, with the dataset being modeled after similar customer datasets that have similar business profiles. The data came in an excel sheet and included four sets of data: Customer Demographic, Customer Address, Transactions, New Customers (Address and Demographics). The ‘New Customers’ dataset was disregarded since ‘Transactions’ only had ‘customer ID’ numbers that were associated with the ‘Customer’ dataset. For the initial data quality check, duplicates in ‘Customer ID’ were checked for and none were found. The data completeness check then showed that Customer Demographic had 96.61% complete data, Customer Address had 100% complete data, and Transactions had 100% complete data. For the initial data clean, the datasets were merged together for ‘Customer Demographic’ and ‘Customer Address’. Then the columns without relevant data were removed, along with removing the rows that did not have a date of birth. Customer rows were also removed if they were marked as deceased and/or born before 1900.
Results:
The initial results showed two seasonal spikes in monthly sales due to both summer weather and holiday shopping, with sales ramping up in June and then slowing down in September, before ramping back up again in October and slowing back down in December.
![]()
The results then showed that while most bike sales came from ‘standard’ or ‘road’ bike types, it was the ‘mountain’ and ‘road’ bike types that proved to be a lot more profitable.
![]()
Given these insights on bike type profitability, potential trends in sales by bike types were further looked into by analyzing trends in monthly bike sales – to see if it would make sense to focus advertisement for these bike lines on certain times of the year. Unfortunately, no such monthly trends were found for bike sales by bike type, with bike sales by bike types following the same overall sales trend.
![]()
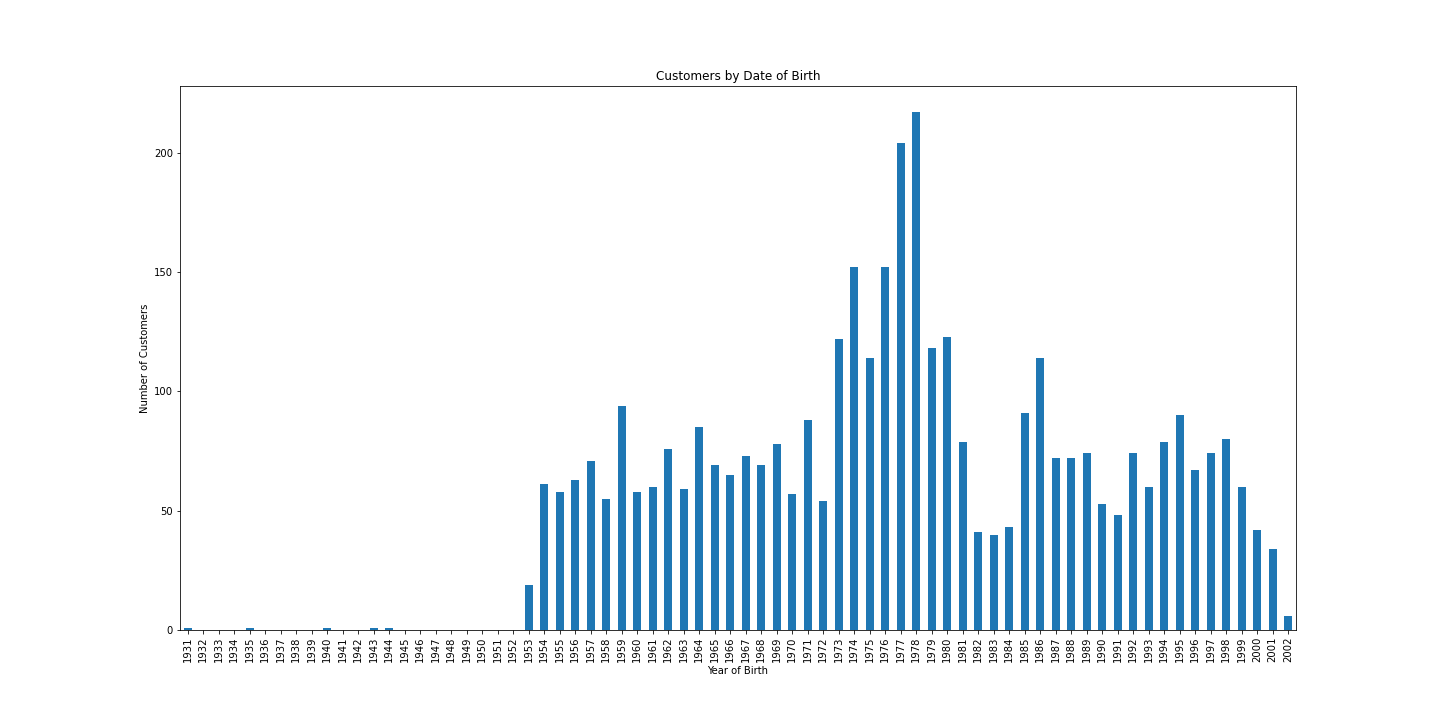
Then the initial exploration into the customer base starts by seeing that most customers were born between 1871 to 1981 – with the most popular age group being in-between 40-to-50 years of age.
Customer purchase frequency was then explored – with the majority of customers having between 3-to-8 bike purchases in the past 3 years, which translates into roughly 1-to-3 annual bike purchases per customer on average.
![]()
And while there was only a marginal difference in average profit per transaction on a monthly basis.
![]()
A significant uncovering in the transaction dataset was the clear difference in profitability by wealth segment, with the customer group ‘mass customer’ being twice as profitable as the other two groups ‘affluent’ and ‘high net worth’.
![]()
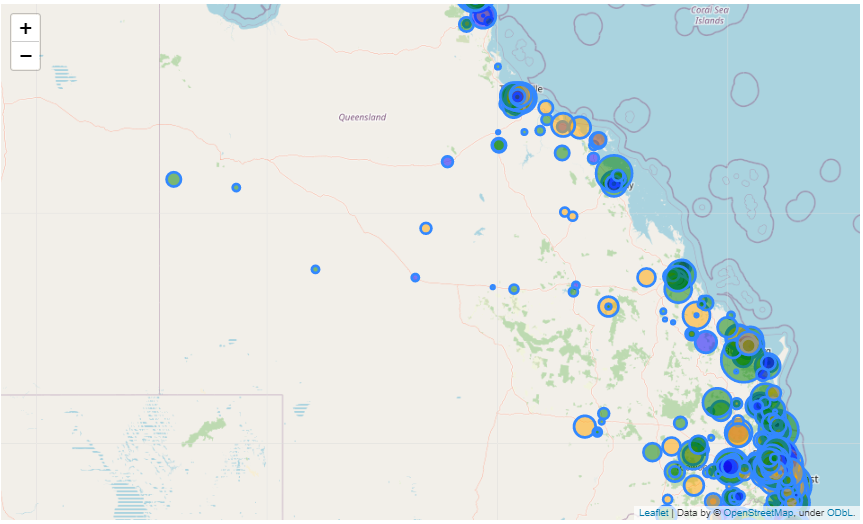
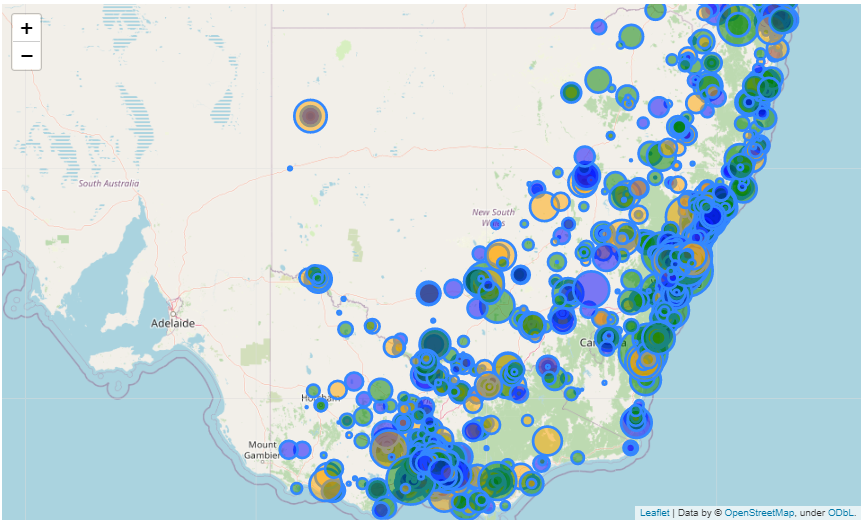
After having uncovered the significant differences in profit by customer segment, customers were then mapped out by wealth segment (color) and total profits (bubble density). But no geographic trends were uncovered - other than sales being concentrated along major coastal cities.
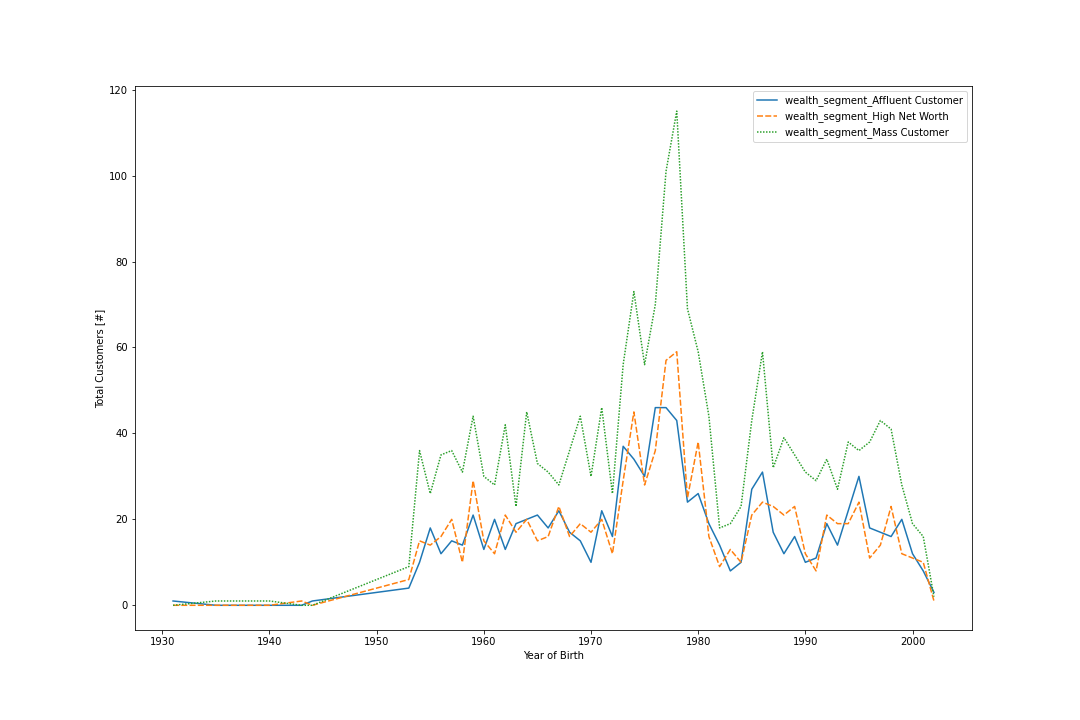
Customers by date of birth and wealth group were also analyzed to find potential differences, but found that each customer group had a similar distribution to the overall customer age trend (40 - 50 years old).
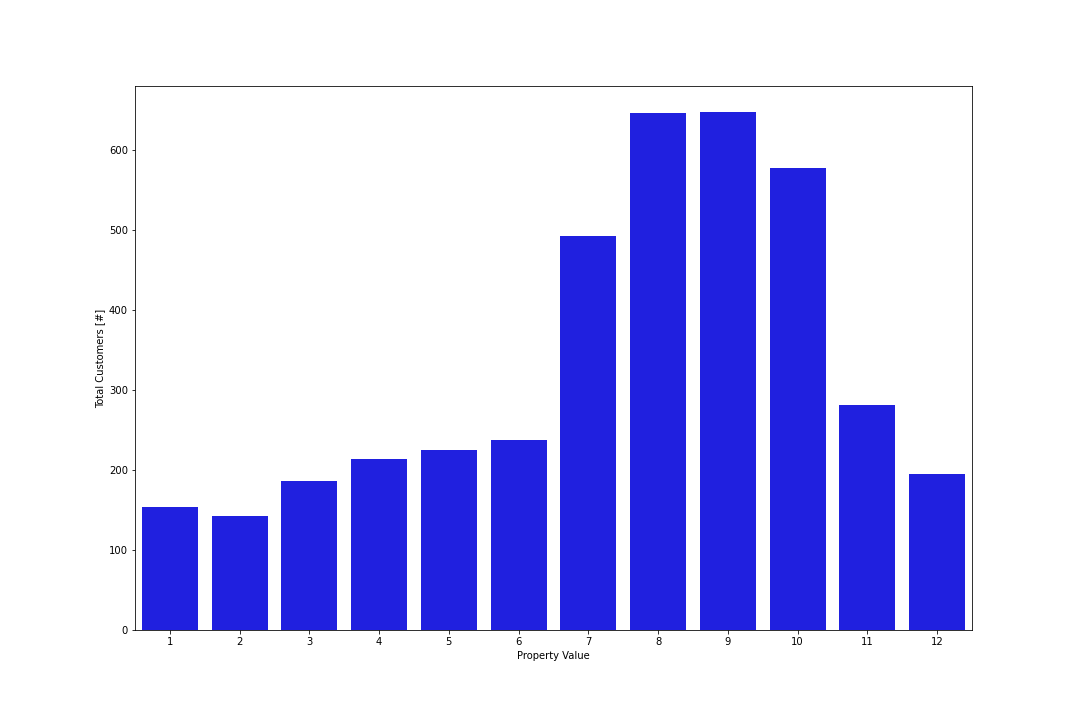
Given the differences in customers by wealth group, one last thing that stood out from a geographic standpoint is that most customers reside in areas that have similar property values – with 7-to-11 being the most popular range.
Discussion:
From the exploration of the data, an ideal customer profile emerged in the form of someone who is: between 40-to-50 years of age, in the ‘mass customer’ customer group, and has property value(s) ranging between 7-to-11. And while the original goal of the study was to also develop a predictive model that helps predict new sales for new customers on an individual basis, a successful model wasn’t created without referencing the ‘bikes purchases in past 3 years’. This was taken out of the model to help it work well with real data, but it should be further explored since this variable had the greatest predictive power for predicting new purchases when it was implemented. And to help with customers who haven’t been in the CRM for 3 years, this variable can be used by shortening the timeline for ‘number of bike purchases’ to the past year or two, for a predictive model that helps predict new sales with newer customers as well. It is also important to note that the ‘age of customer record’ wasn’t included in the dataset, which is something that could help with similar datasets in the future.
Looking into the variance in purchase frequency, it could be that our customers are in the age range where they would also want to purchase bikes for themselves and their spouses and / or children, in order to bike together as a family activity (or not). Which is great insight and advice for maximizing marketing, by maximizing marketing spend right before the summer and holidays - to target people in their 40-to-50s and with property values between 7 and 11. Seeing how biking also seems to be a lot easier on the joints then running, this could also be a great marketing point to also potentially focus on (given the age range for most customers).