
LA County Sociodemographic Clustering - Coursera Capstone

Project Summary
Through a dataset provided by the US government, cities in LA County will be grouped into clusters based on sociodemographic scores to develop benchmarks for each cluster. This will help city officials identify what are the biggest areas for improvement based on cluster (i.e., mental health to upper-class vs school quality to lower-class). Along with mapping out LA County based on socioeconomic clusters to help identify potential visual patterns.
Introduction
With the national debt in the US being at an all-time high, having local levels of government being more efficient with their funds could be a great opportunity for most cities – with LA being a great case study. Seeing how Los Angeles County is very diverse and has the largest population for a county in the United States (larger then 41 states individually), there is a lot that can be learned from studying its goverment policies and how socioecomonic standards can vary widely from city-to-city within LA.
Depending on what part of Los Angeles you happen to be in, you can go from the mecca of the entertainment history (Beverly Hills) to areas that resemble 2nd and 3rd world countries (Skid Row, South Central) in a quick 10-20 minute drive. This is sad to see because there is no shortage of sympathy and tax-payer funding [in California] for people who want to get their life back together, but sadly it seems that most resources aren’t making significant contributions in lowering homelessness and crime rates. A large part of the problem comes from not being able to efficiently prioritize public resources and zoning opportunities based on sociodemographic scores for each city.
Given the size and complexity of LA County, one-size-fit-all approaches don’t work, so instead socioeconomic scores are going to be used to create clusters of cities to help get a better understanding of LA. By grouping cities into clusters based on sociodemographic factors, this will allow city officiails to get a better understanding of why some programs work well for one socioeconomic group and not the others (i.e., housing projects benefitting upper-class and lower-class vs hurting middle-class).
Methods
This study leveraged data made available by the County of Los Angeles at (www.data.lacounty.gov/), titled the ‘A Portrait of Los Angeles County using the Human Development Index: GIS Data’ available at (www.data.lacounty.gov/Community/A-Portrait-of-Los-Angeles-County-using-the-Human-D/j7aj-mn8v). The goal of this study was to group cities within LA County into clusters of groups based on socioeconomic scores to help indentify population averages, socioeconomic benchmarks, and potential indicators of success (i.e., income, school enrollment, life expectancy, etc.). This study used unsupervised machine learning methods to cluster cities into groups, based on socioeconomic factors. The socioeconomic clusters map for LA County are also be mapped out according to help identify potential visual trends (for future studies).
Initial data analysis started with an heatmap and histograms for each feature, to find sociodemographic variables that were similar and to be removed.
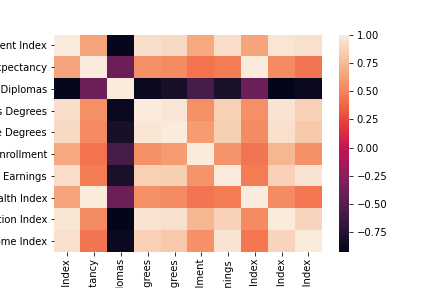
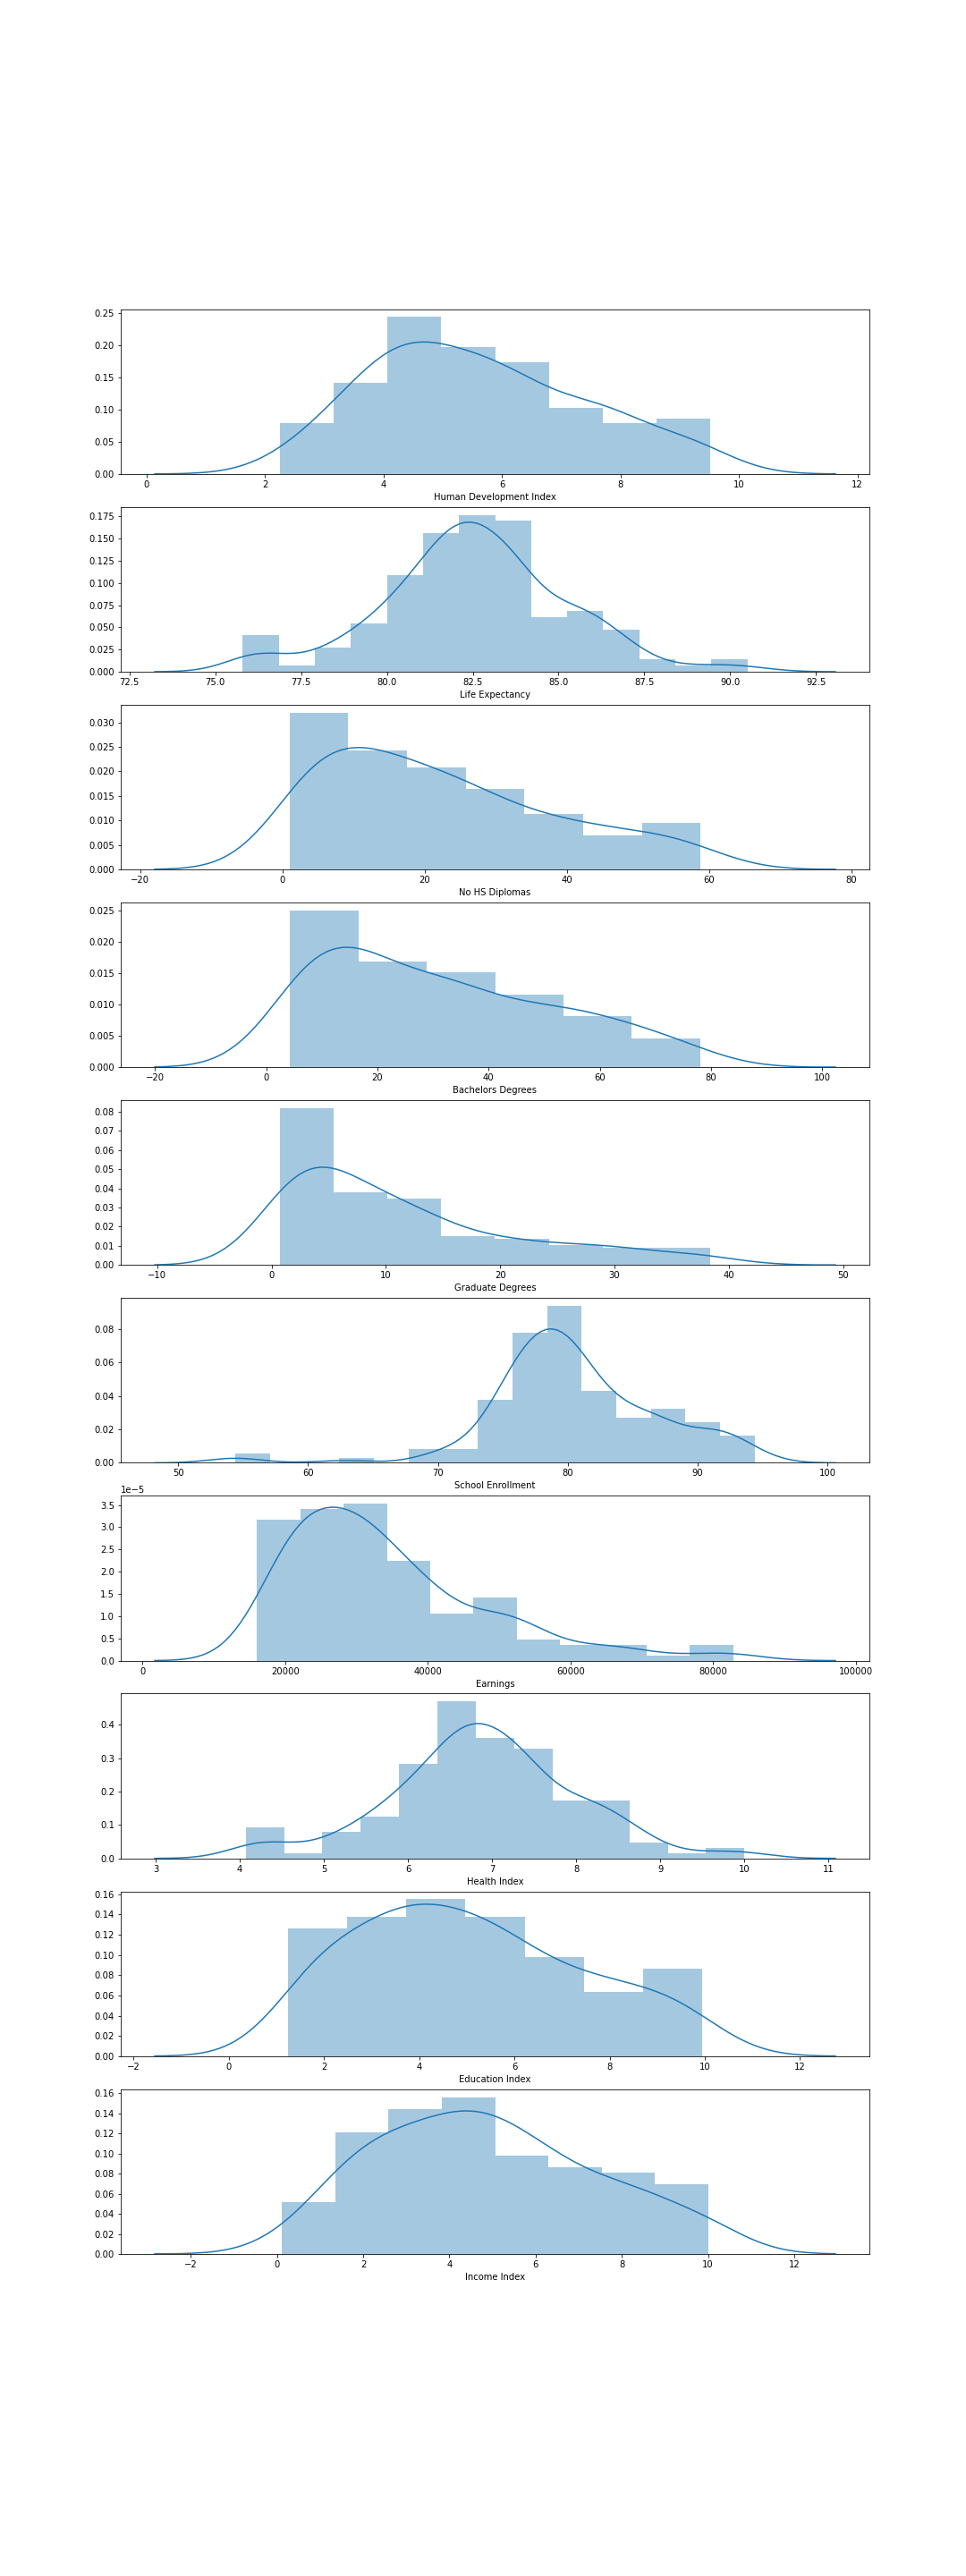
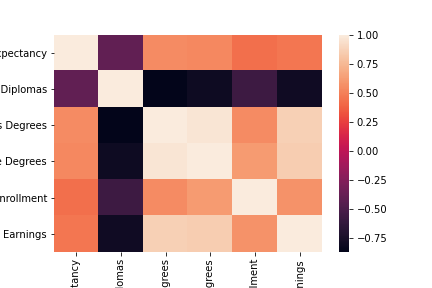
For the initial data clean, the index columns were removed because of the overlap in distributions.
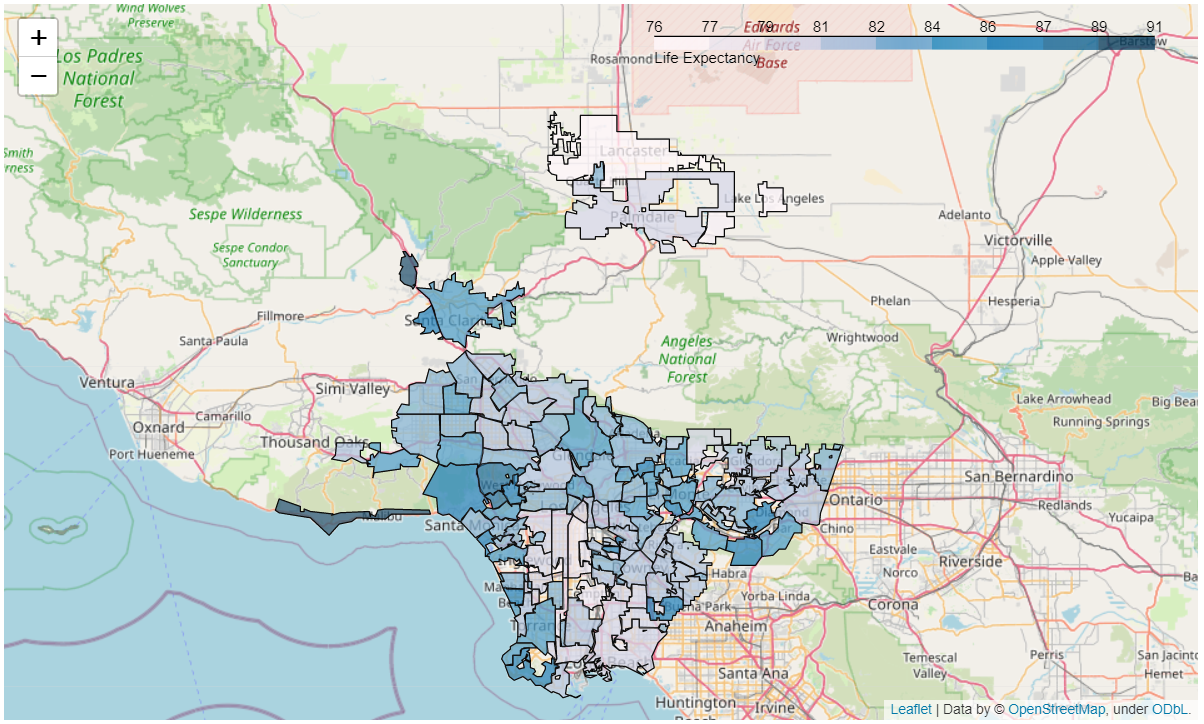
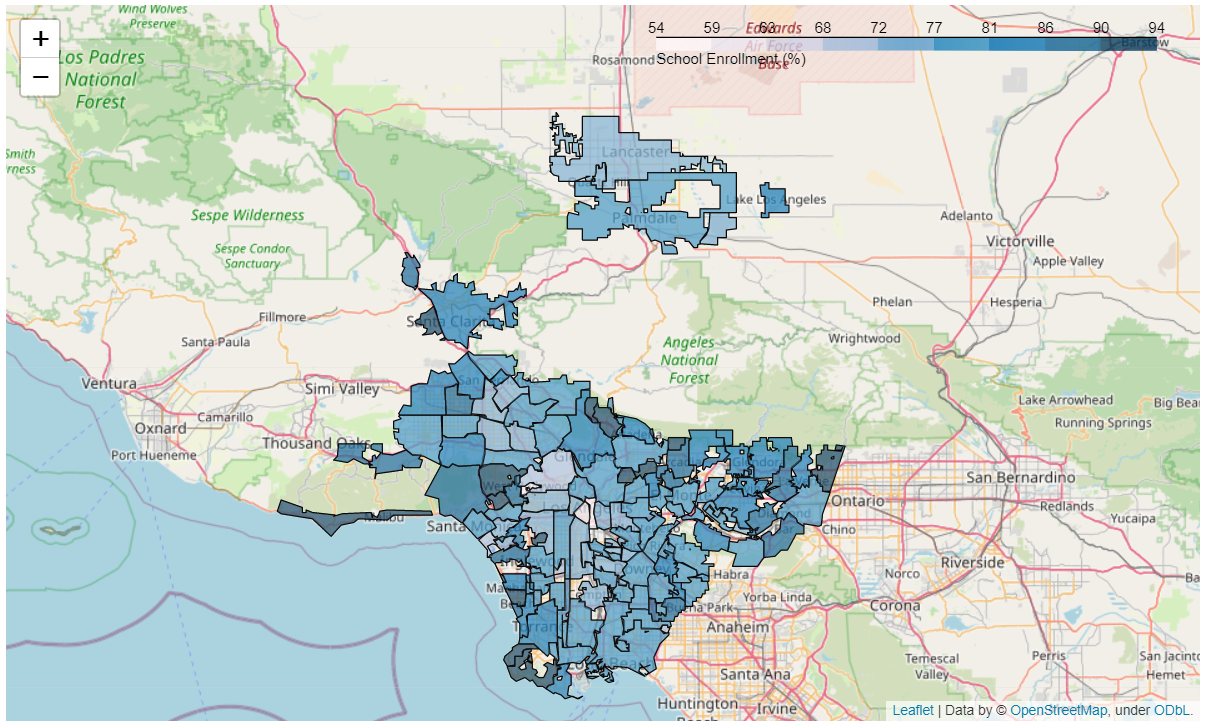
Features were then mapped out onto the LA County map for a visual representation of the variance in sociodemographics scores from city to city.
- Initial Outline of LA County

Maps of LA County Sociodemographics by Density:
- Life Expectancy Map
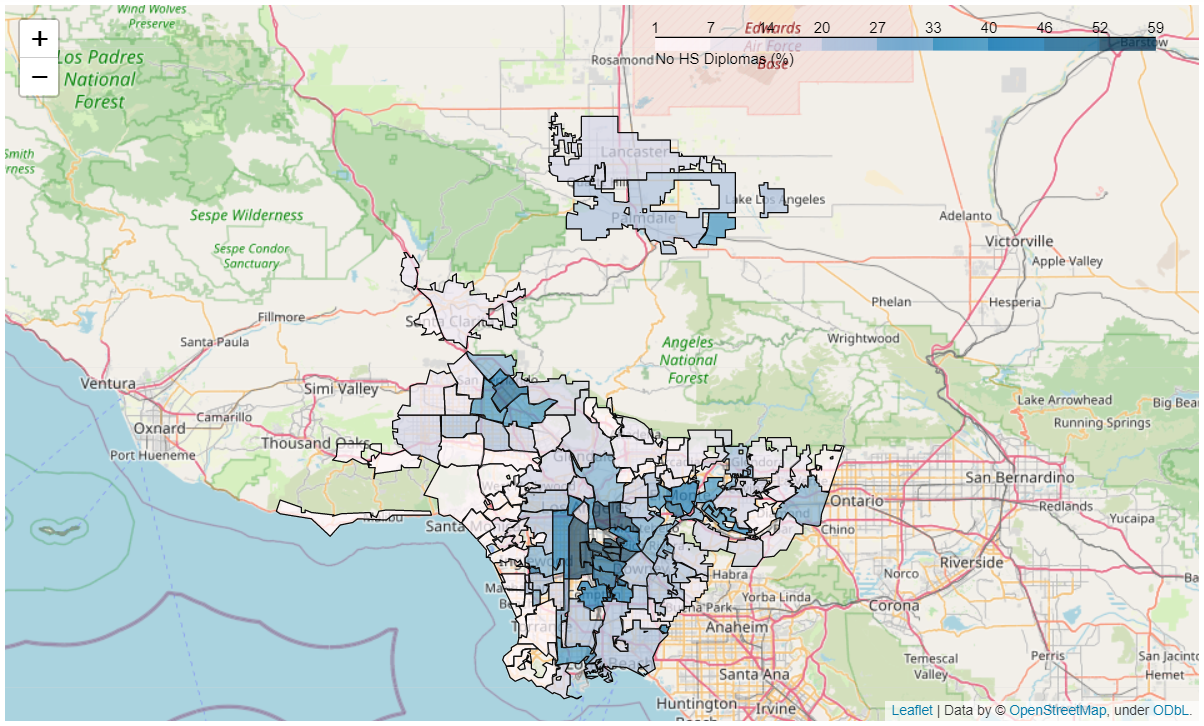
- No HS Diplomas Map
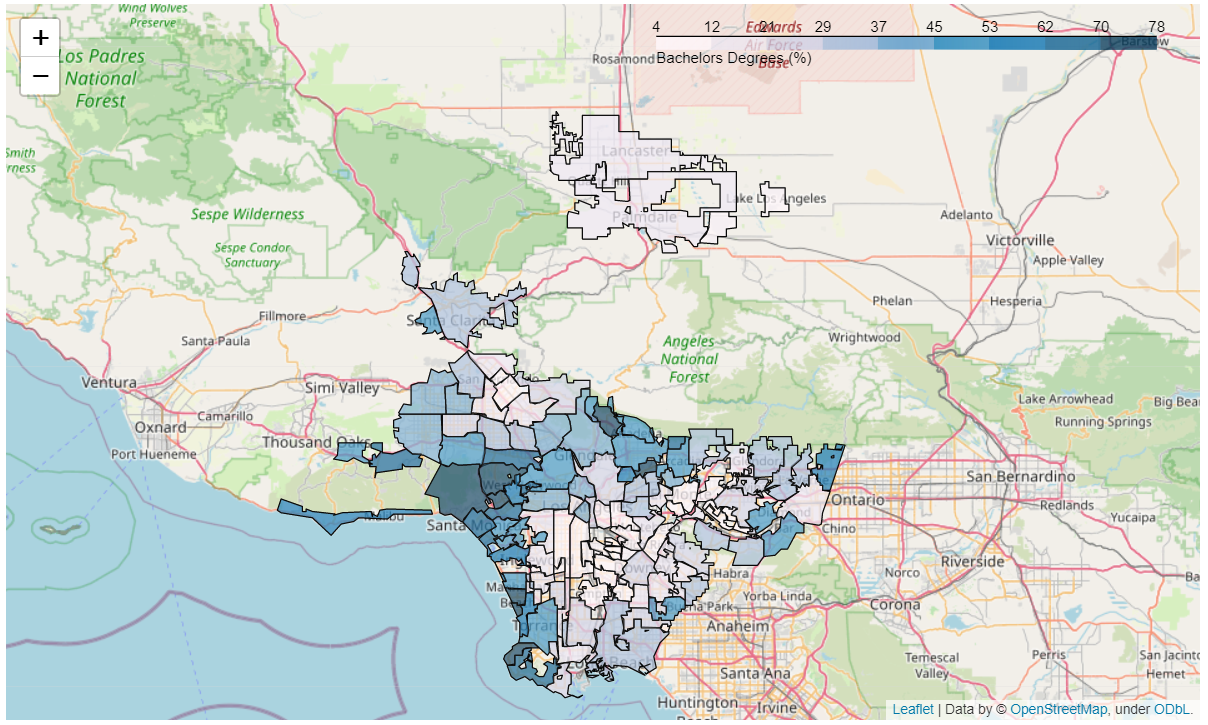
- Bachelors Degrees Map
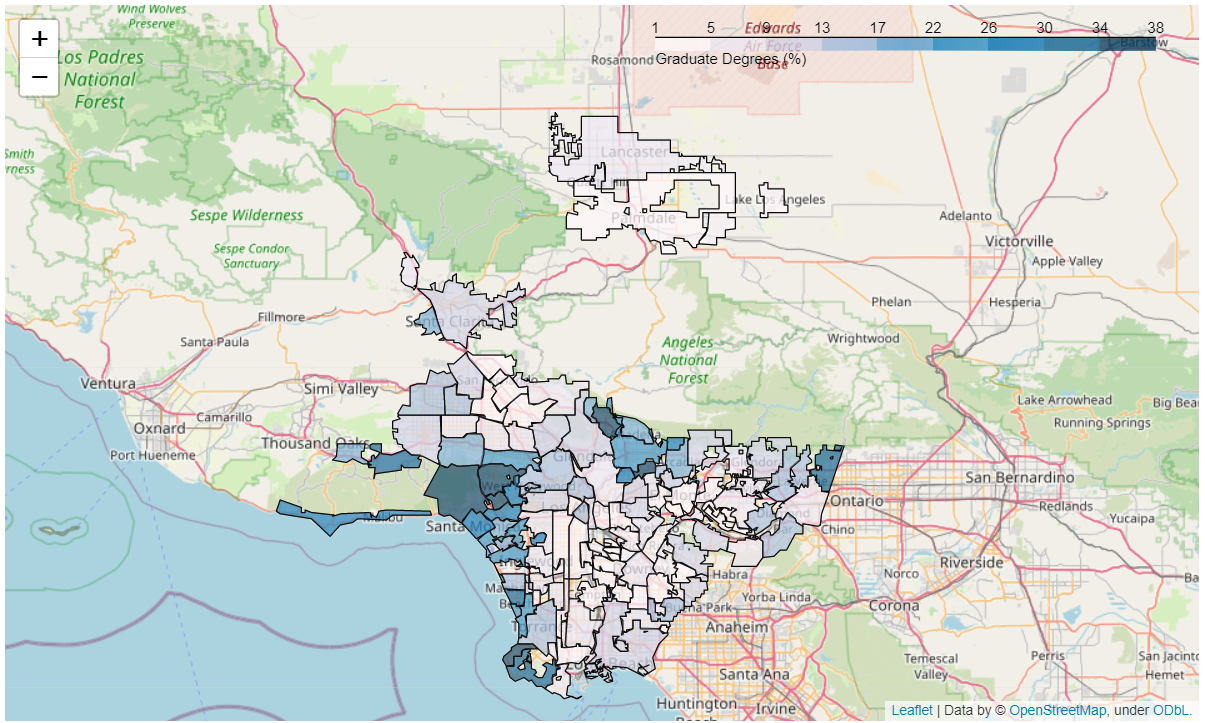
- Graduate Degrees Map
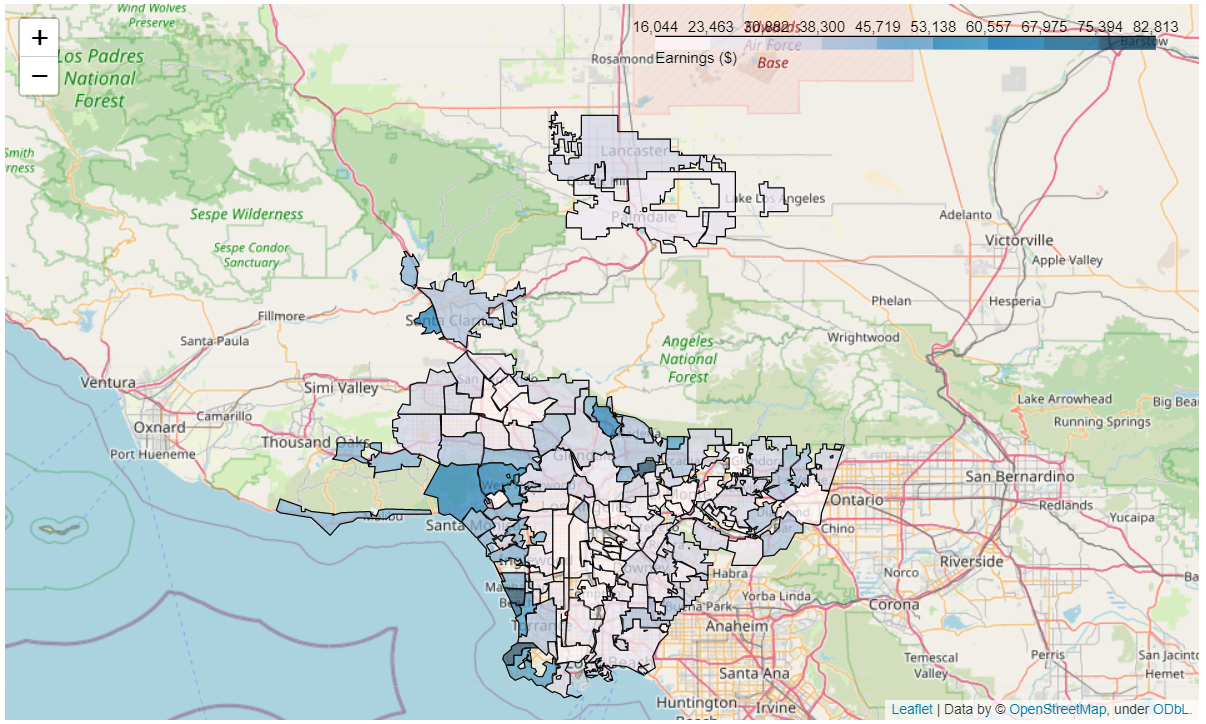
- Earnings Map
- School Enrollment Map
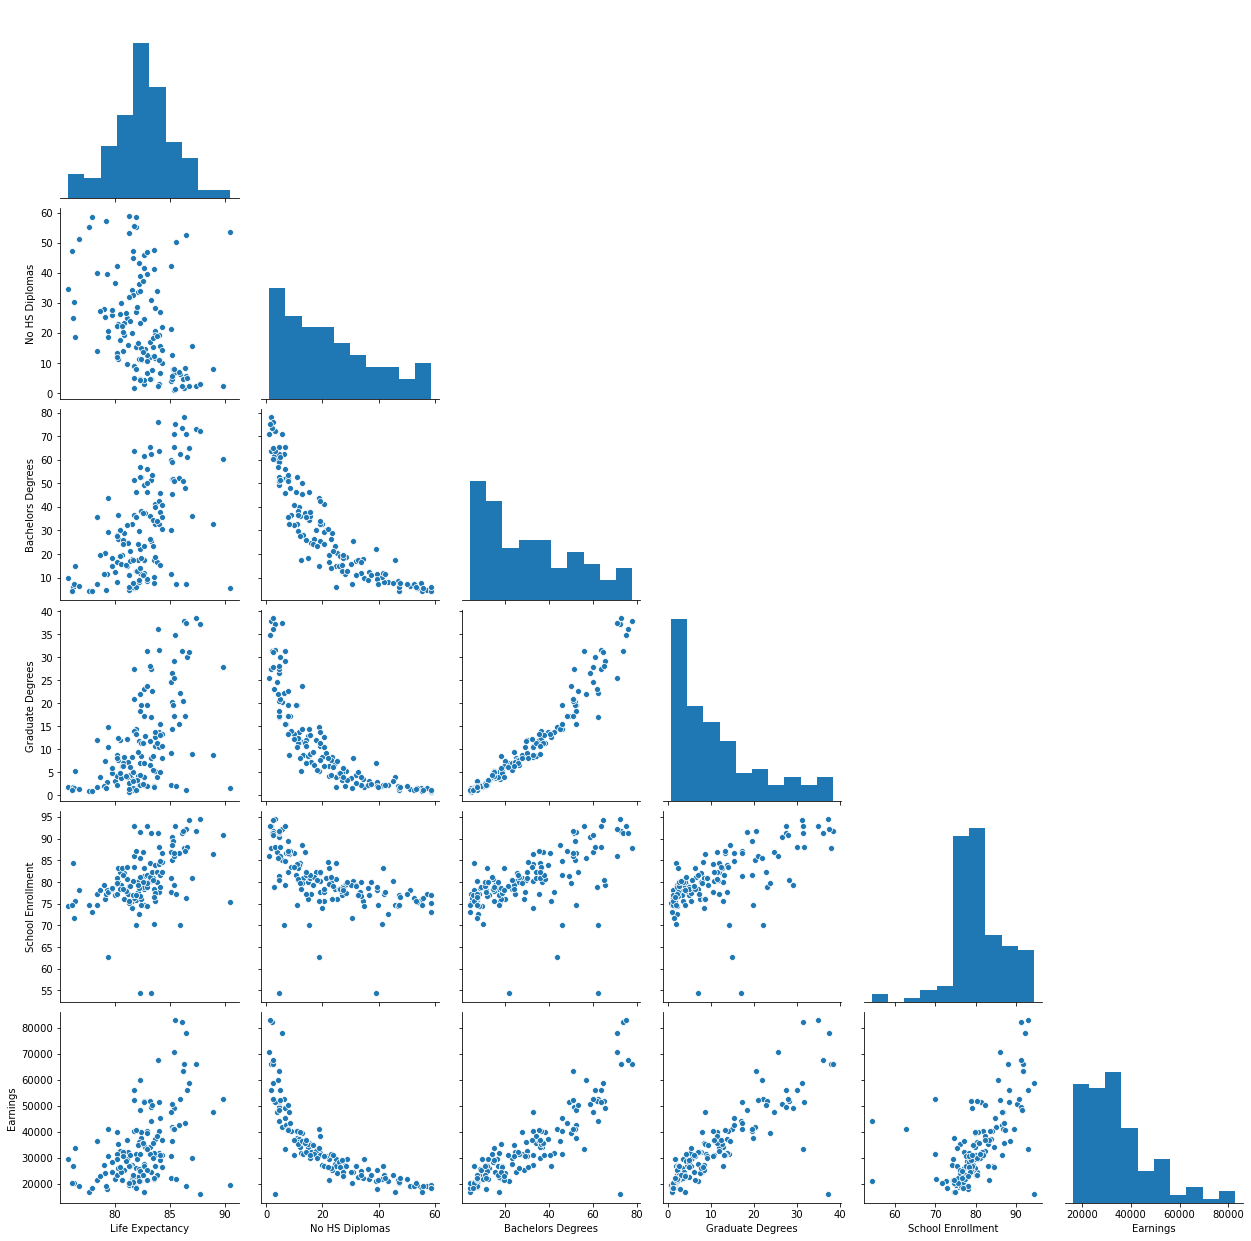
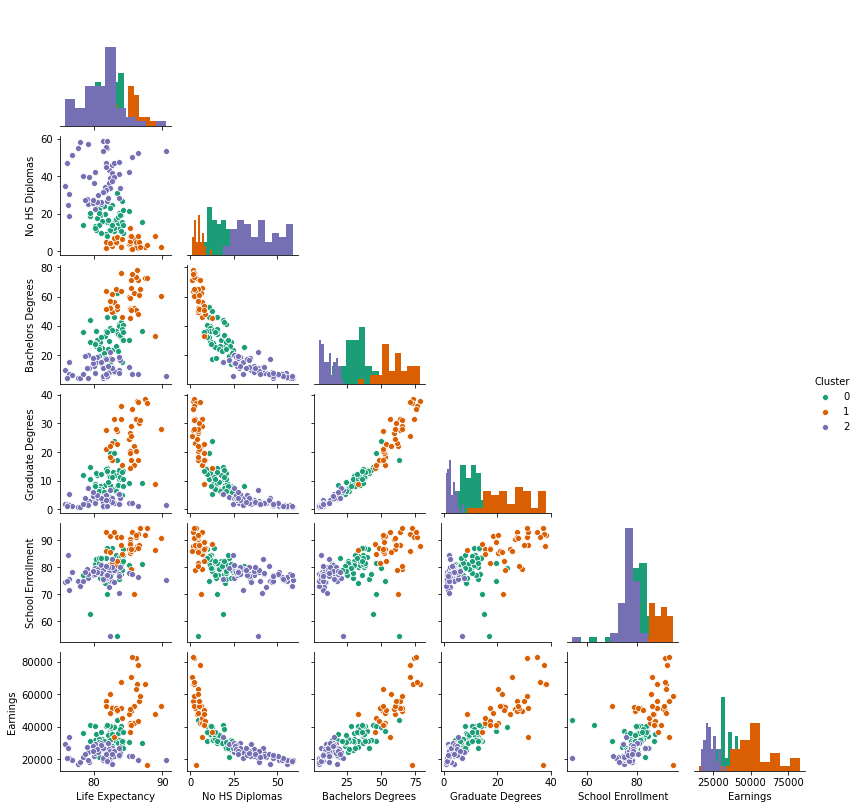
Pairwise relationships are plotted for a visual representation of the interaction amongst the features.
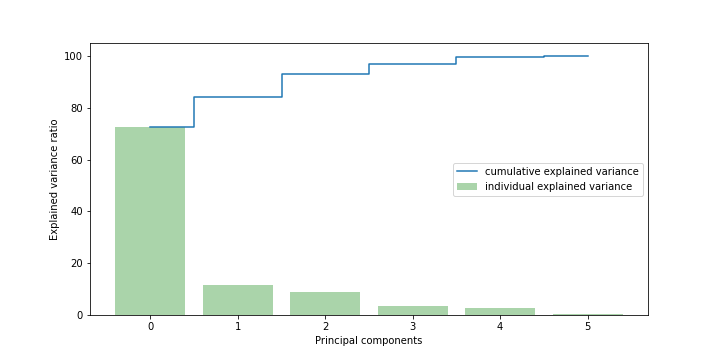
To figure out how many clusters of cities should be created to maximize the results, a principal component analysis is performed to figure out how many clusters would account for the most variance in the dataset. The data is split into 3 clusters to maximize the variance captured in each cluster.
The data is split into 3 clusters using K-Means clustering, to find three local minimas in our data.
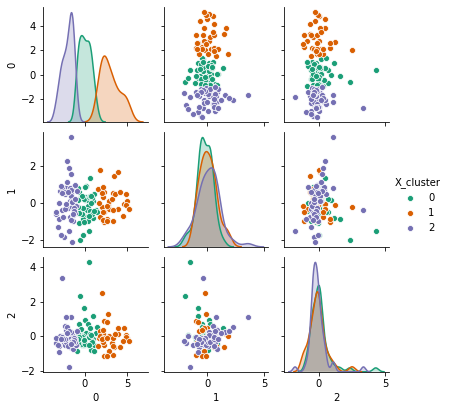
The 3 clusters are plotted by cluster in a pairwise plot to examine how the data was split.
Results
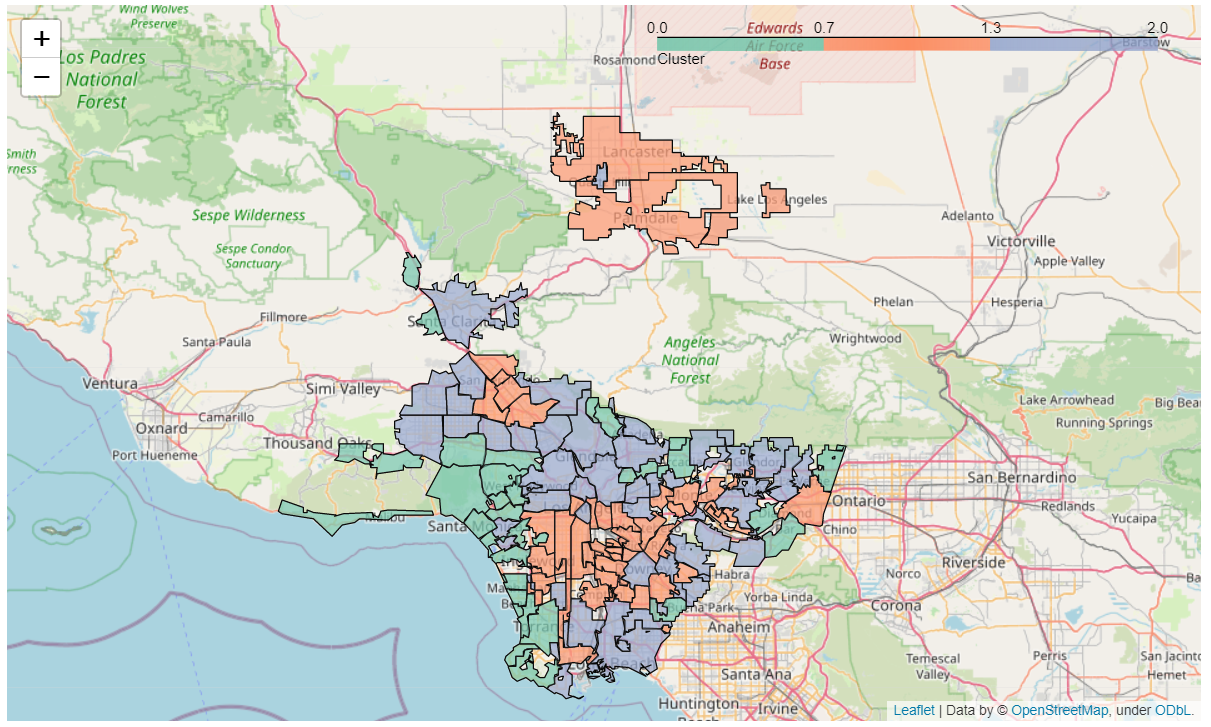
The clusters of cities created are then mapped onto a LA County map for a visual representation of the difference in sociodemographic standards.
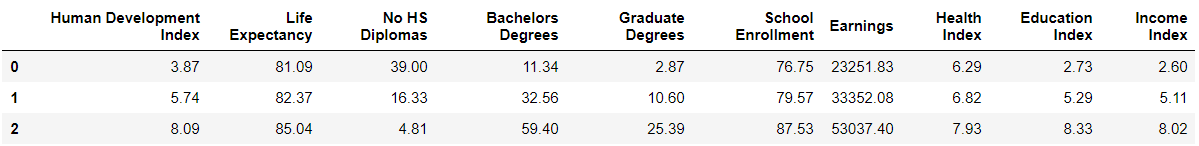
Benchmarks were created to find average socioeconomic scores for each cluser of city.
Discusssion
Looking at the map, there seens to be a clear positive relationship between higher performing cities and their proximity to the ocean, with inner cities regions being the worst performers, along with pockets of middle performing cities that are closer to mountain areas as well. From the breakdown of the averages for the different groups above, the least disparity observed was for ‘life expectancy’ and ‘school enrollment’, while the highest disparity in socioeconomic standards observed was for ‘No HS diplomas’, ‘graduate degrees’ and ‘earnings’.
The differences in scenic surrounding seems to be determined more by preference then job opportunity, but this would be interesting to explore with labor statistics. The huge difference in earnings and graduate degees is very alarming, given the minimal difference in school enrollment. This seems to imply that not all public schools are producing similar results, but it could also be true that cities within LA County are failing to retain people who grew up there for whatever reason (i.e., crime rates, no housing, etc) when they do start earning more money. Studying the data with emigation patterns and immigration patterns within LA would be very interesting, to see who those factors interact with socioeconomic standards.
By clustering cities together and creating socioeconomic benchmarks for each city cluster, hopefully this provides insights to city officials that can help them judge the effectiveness of the public programs that are in place. By tailoring public programs to different socioeconomic needs and city clusters, hopefully this can help maximize all financial resources in LA County.